


In the last few years, virtual reality (VR) has experienced advancement after years of hibernation. As compared to traditional mediums of data visualisation, VR as a medium is significantly different, and the use of VR in data visualisation has not been explored much.
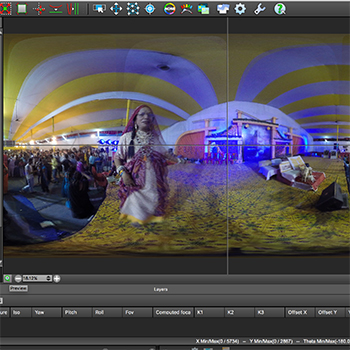
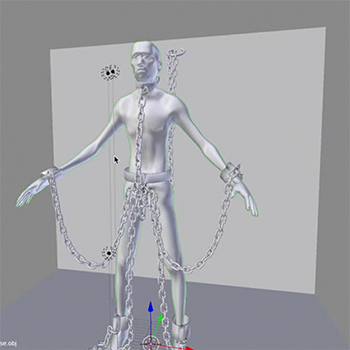
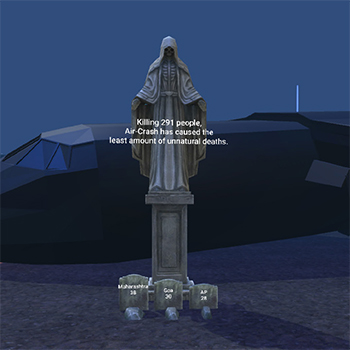
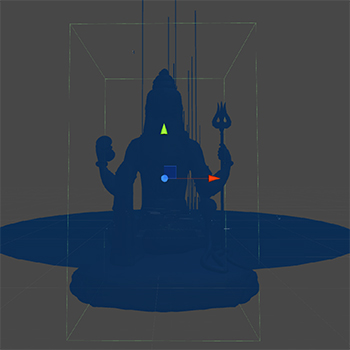
This report explores the process of visualising data in virtual reality by creating a data story by drawing upon various visualisation and design principles in two dimensions (2D) and extending them in three dimensions (3D). By using government data on unnatural deaths, the design process includes exploring the data, generating design ideas, and iterating prototypes to come up with the final design.
The project, deployed as a VR application, is multiplatform and can run as a standalone application or in a web browser. The evaluation takes into account observations, feedback, and suggestions for improvement while measuring the impact and fine-tuning the experience.
The project is an example of what is possible. It shows that VR data visualisations aren’t inherently intuitive but can make more sense if delivered through storytelling.