
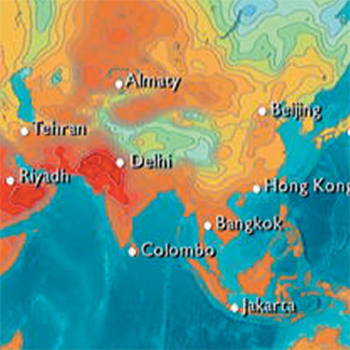


Information graphics are visual representations of any information, statistical data, or reconstruction of an event. The graphical display of information is among the most obvious and important forms of visual communication. The organisation of realistic data into a field that is recognisable at a glance yet can be studied and probed over a period of time can prove to be a useful tool that offers tremendous value to both the audience and the designer. Graphics can describe information in a better way through visual mapping. Visual aids can compress huge amounts of information into smaller, more comprehensible capsules.
We are aware of the presence and importance of graphic representations throughout the history of man. Diagrams, maps, charts, and many other kinds of symbols take part in our daily lives. All visual media have explored various aspects and advantages of infographics, and television media is no exception. The dynamism of TV media offers more scope to the designer and broadens the horizons of possibilities. Graphical representations benefit from the fourth dimension of 'time', and can help create better.