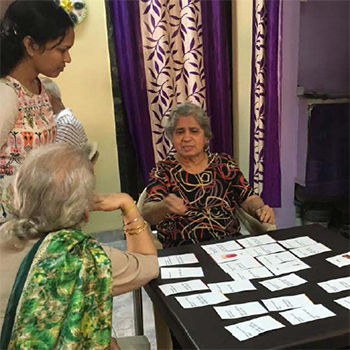
Data visualisation is a general term used to describe any attempt made to help people understand the significance of data by placing it in visual context. Creating an effective visualisation is a challenging task which requires the designer of the visualisation to take mindful decisions at various phases of the process of creation. Through this project I attempt to make a methodological tool to help students understand the basics of data visualisation. The tool developed is in the form of a deck of cards (VizSuit) designed to guide students through the linear-multi-iterative process of creation of any data visualisation.


