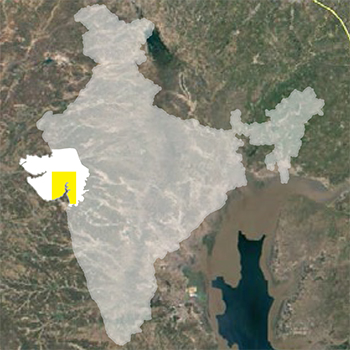
Indian government records and releases vast quantities of data about us and our surroundings by means of the census, crime, budgets, population, human development reports, etc.
The national crime record bureau under the ministry of home affairs is sharing the crime data at different levels, which can be used to find insight about the crime rate in India and can prove to be very helpful to analyse the cause of crime up to a certain extent.
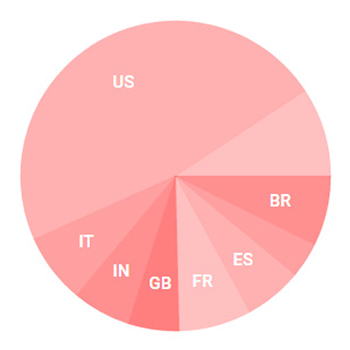
This project aims to enable an easy way to visualise the crime data in India. This is done by means of a web-based application of the open data visualisation tool provided by the OGD platform. The higher goal is to enable faster and better decision-making by means of data visualisation.
The series of interactive visualisations will help people understand the crime data from India. Interacting with and observing the crime data visualisation will help the user find correlations, causes, effects, and trends.


