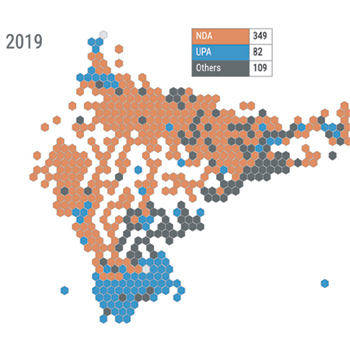
Interactive Data Visualization and Analysis of Election Results was the project of Prof. Venkatesh Rajamanickam. Starting from 2016 to 2019, the project explored the presentation and analysis of election results through a series of interactive data visualizations. The objective was not only to explain phenomena through visual representation of information, but also to discover new insights and new meanings through visual exploration of information. Affordances of the medium, devices of delivery, data iteracy of audiences, use of regional languages, etc., were taken up for inquiry. Some of the visualisations were widely disseminated through popular publications and written up as academic papers.


