Jump to navigation

  •  
  •  
  •  

  • Courses
  • Resources
  • Case study
  • Showcase
  • Tools
  • Gallery
  • Videos

Search form

Animation Design Communication Design Design Fundamentals Interaction Design Product Design Tools for Design Open Design
Home / Resources / Lost Indian Festivals / Background Reading

.

  • yohoho
  • Design Resource

    Lost Indian Festivals

    Information Visualisation of Festivals celebrated by Women in India
    by
    Richa Agarwal and Prof. Ravi Poovaiah
    IDC, IIT Bombay
    Background Reading
     
    • Printer-friendly version

    I looked at examples of cultural mapping and information mapping to understand ways of data organisation for the visualisation.

    • Cultural Mapping

    Cultural Mapping is a systematic approach to identifying, recording, classifying and analyzing a community’s cultural resources.

    The cultural map of St. Thomas (2015) (see Fig 2) serves as a gateway for organisations, businesses, community groups and the public to easily identify and explore the city’s assets.

    col-sm-12

    ‹ › ×


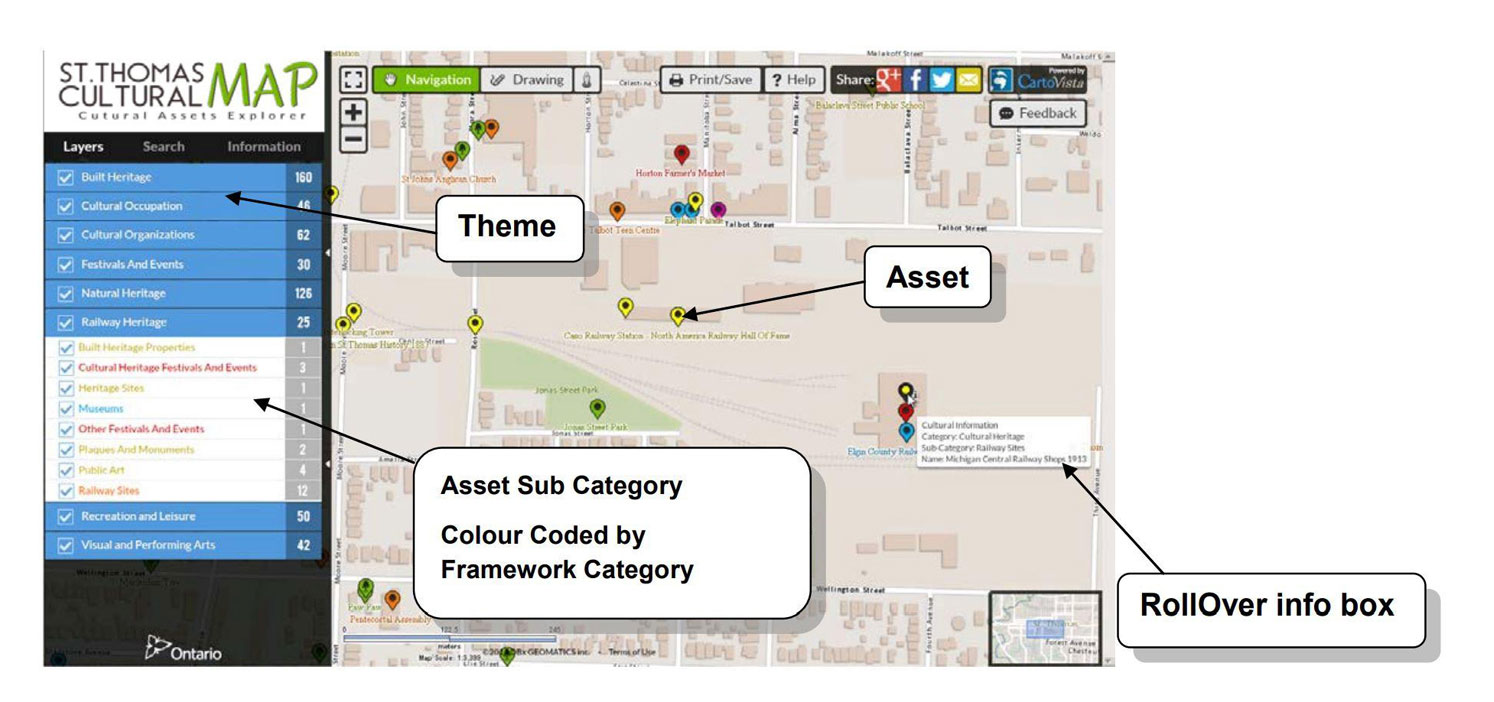
      Fig 2. St. Thomas Cultural Map (2015)

      The cultural map may consist of layers, keyword search, information window, annotation and drawing tools.

      • Information Mapping

      Information Mapping is writing without paragraphs. Instead, there’s a set format to guide the writer and reader along the easiest pathway to communication (Horn et al., 1974).

      It involves identifying, categorizing, interrelating and sequencing, and presenting graphical information for learning and reference.

      It increases reading efficiency as it can be simple, modular, an expandable classification system and consistent by using information blocks, information map, unit and course (see Fig 3).

      It is used for conceptual, procedural, process, classification, structural and decision information.

      col-sm-12

      ‹ › ×


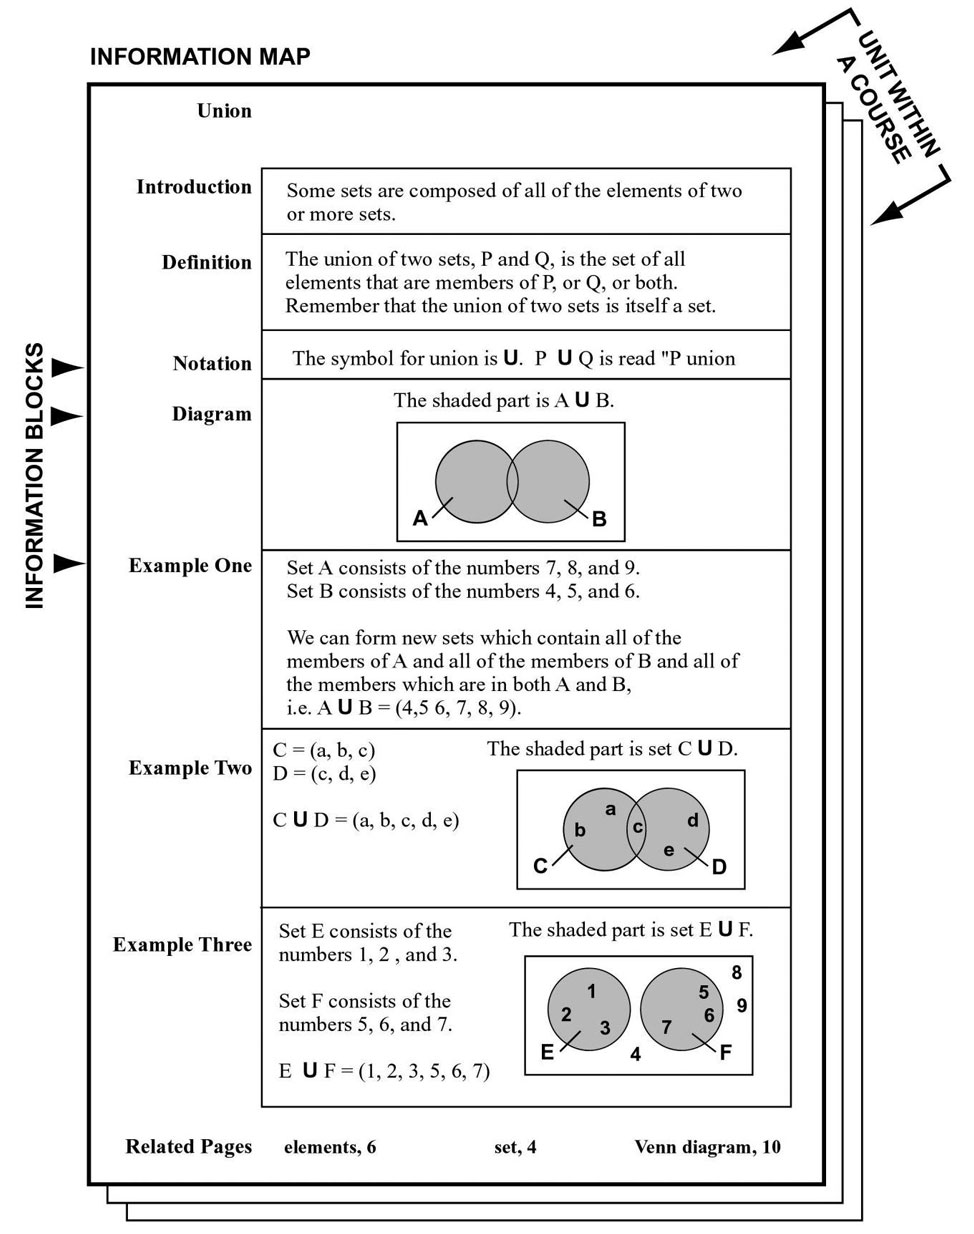
        Fig 3. Information Block, Information Map, Unit, Course (Horn et al., 1974)

        The principles of data organisation used by these methods were used in data analysis for the final visualisation.

        • Introduction
        • Background Reading
        • Data Collection
        • Data Analysis
        • Ideation
        • Design
        • Final Visualisation
        • References
        • Downloads
        • Contact Details
        • Credits

        Creating Digital-learning Environment for Design


        • Courses
        • Resources
        • Case study
        • Showcase
        • Tools
        • Gallery
        • Videos
        • Animation Design
        • Communication Design
        • Design Fundamentals
        • Interaction Design
        • Product Design
        • Tools for Design
        • Open Design
        • Contribute to our Dsource
        • About
        • People
        • Events
        • Job@D'source
        • Contact Us
        • Privacy Policy
        • Download App
        • YouTube
        • Facebook
        • Twitter

        Indian Language
        English Bangali Gujarati Hindi
        Kannada Malayalam Marathi Punjabi
        Sindhi Tamil Telugu Urdu