Design Resource
Lost Indian Festivals
Information Visualisation of Festivals celebrated by Women in India
by
Data Analysis
The data collected was analysed to map to on a timeline, identify themes, categories of objects included and sensory experiences.
The themes identified helped answer questions related to the activities in the festivals - which God was worshiped, whether fasting was involved, when was pooja practised etc. The rituals were mapped based on the time of the day which helped understand when most of the festival activities happened. Categories of objects involved in the festival were identified. Sensory experiences such as creating visuals, smell arising from cooking activities and sounds from singing/storytelling were also identified.
Fig 6 shows the data analysis for the five festivals.
Through this analysis, a holistic picture of the festivals was created. The timeline and themes could serve as a structure for data organisation while the categories and sensory experiences could be visualised in different ways to capture the essence of the festivals.
Similar and different themes, categories and sensory experiences could also be observed across different festivals.
Cross-Analysis
Through a cross-analysis, common topics with different information were identified and organised to create the final visualisation.
Common topics included -
-
Tithi
-
Objective
-
Ishta Dev
-
Bhog
-
Pooja Thali
-
Ardhya
-
Bayana
-
Pooja Rituals
Representing the festivals under a structure created by these common topics would enable comparing the different festivals visually.
The final data organisation for all the five festivals used in the final visualisation can be viewed here.

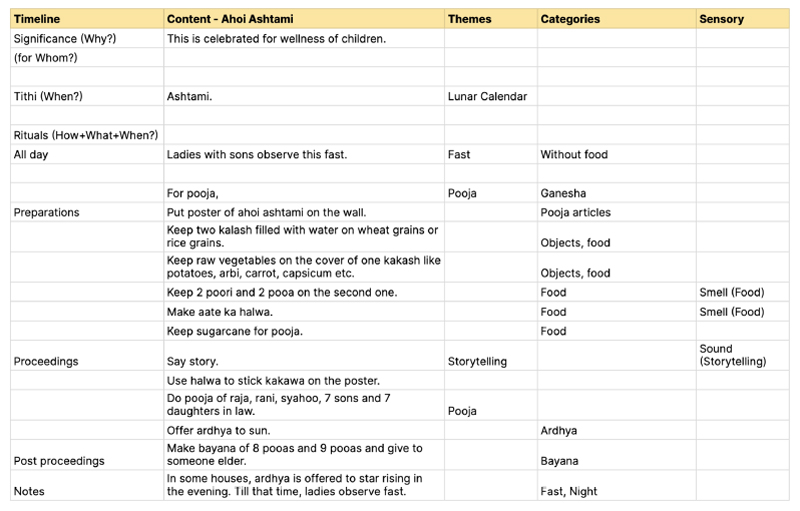

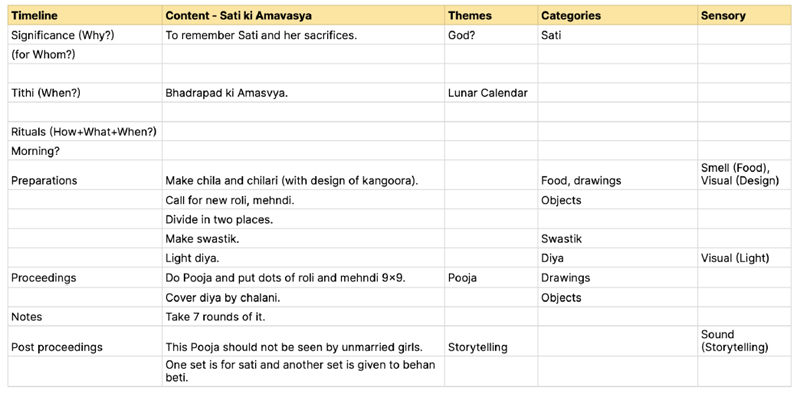

Fig 6. Data Analysis - Sakat Chauth, Ahoi Ashtami, Gan Gaur Pooja, Sati ki Amavasya and Karwa Chauth.