Visual Communication
Batch 2018-2022
(14 items)

Visual CommunicationBatch 2018-2022
(14 items)
(14 items)
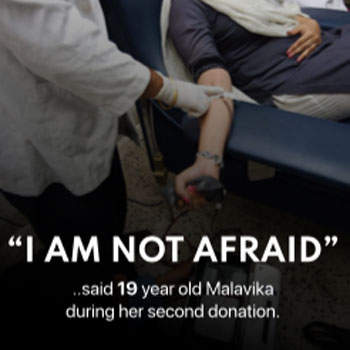
Design Strategy to enable more periodic blood donations in India to tackle the current shortage of blood
by Anagha Aneesh
by Anagha Aneesh
India is currently facing a shortage of blood due to the lack of voluntary donors and the lower frequency of periodic donors, as they are concerned about the safety regarding donations after the pandemic. A major fraction of the adult population was found to be unaware of the requirement and the urgency of the situation and often give in to misconceptions leading to no donation. This project aims at understanding how to tackle the high demand and low supply of blood in the country and identify motivations that could aid the situation by studying the common trends and demographics of periodic donors and understanding the level of awareness that people have in this sector. The main objective of the study would be to devise how to bring in more first-time donors and encourage repeated donations to tackle the current shortage of blood in the country. Two types of studies, both qualitative and quantitative, were conducted. The findings from the study were mapped out and overlapped with the findings from existing literature to derive major conclusions.
Details >>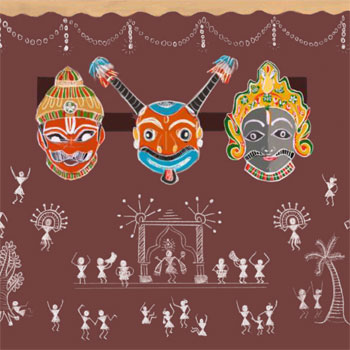
Infographic on Warli Festivals being celebrated by their Community
by Drishti Das
by Drishti Das
The project aims to document, classify, and experiment with information visualisation of cultural events in India. In this project, I focus on how the Warli community of Palghar district celebrates their traditional festivals by depicting traditional Warli paintings on their house walls. I started by revisiting and analysing our old project. With the project aim/motivation in mind, I collected more information about their culture through secondary research and organised the data according to the decided relevant factors for the visualisation, then explored some ideas. The final output communicates the ways these festivals are celebrated in Warli culture by depicting the traditional Warli paintings on the walls of their houses, with people and decorations in the background, mimicking their household during that occasion. It serves as a way of exploring their culture for newbies to lightly get introduced to their culture.
Details >>
Image Transformation and Representation
by Krishna Nair
by Krishna Nair
Image Transformation and Representation is a visual communication project by Krishna Nair (Batch 2018–2022, IDC, IIT Bombay). The work investigates ways to reinterpret and represent images—transforming them in creative, meaningful ways—likely through digital or media formats. It explores how imagery can be manipulated to convey deeper narratives or alternative readings beyond the surface appearance.
Details >>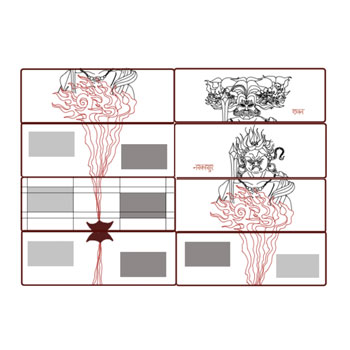
Multilingual Storytelling
by Krishna Nair
by Krishna Nair
India is a country of many languages. In fact, it is a country that has been divided on the basis of languages. Each of these languages holds within it a treasure trove of knowledge and historical memory. This is reflected in the stories told in these languages. As part of the system design project done last semester, I’d been able to look at language learning within the context of the Indian Education System. The final output of this project was a community publication company for digital and print media called Bhaasha Co. Through this project, I have attempted to take it further and use storytelling as a means to bring people from different linguistic communities together. I was quite keen to bring together multiple languages in the same plot and space. Zines seemed to be an interesting way to achieve this. The use of such a medium that also made artistic collaboration easier fit in quite well with the Bhaasha Co. narrative.
Details >>
Online lecture on Design Principles: Visual Semiotics
by Nidhi Deshmukh
by Nidhi Deshmukh
This project aims to teach the basics of semiotics to an online audience in a manner that’s engaging and easy to understand. The task was to structure and conduct an online lecture teaching one basic design principle to students who are just starting out in design. This was to be based on the course we took in our first and second year at IDC. It was necessary to keep the content simple and easy to grasp while being effective and easy to apply. Learning in an online environment takes a toll on the mind and can get boring and exhausting. The project explores creative ways to make online learning interesting and effective by relying on animations, interactive exercises, and a dry sense of humour.
Details >>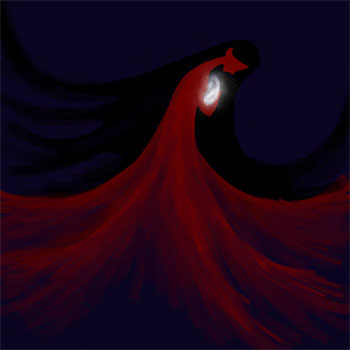
Exploring narratives depicting morally ambiguous decisions
by Nidhi Deshmukh
by Nidhi Deshmukh
I often get into discussions and arguments with people where I try to understand the motivations behind everything the person says and does—especially when it’s a person with completely opposing views. This project started as a similar exercise to see if I could justify some behaviour that goes against my personal beliefs—to see if it was possible to understand and empathise with a character making unhealthy decisions because of their circumstances. This story treads the dangerous path of moral ambiguity, of what is acceptable and what isn’t in difficult situations. It makes the reader ponder over the uncomfortable decisions the characters must take when pushed into a corner and forced to take desperate actions. In this project, I attempt to break away from my usual visual style and create an immersive illustrated short story.
Details >>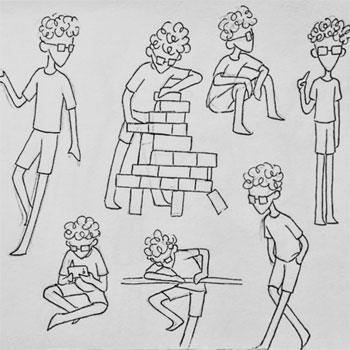
Illustrated story on the adolescent and young adult crisis
by Nidhi Deshmukh
by Nidhi Deshmukh
I have always struggled with imagining and planning for the future. I also struggled with all future-related decisions, like academic ones about picking a stream, field of interest, discipline, etc., or personal ones like what I want to do in the long run, where I want to live, etc. These doubts caused me a lot of distress and, eventually, depression and anxiety. I always chalked this up to me being a very cautious and anxious person by nature. I would and still can worry about everything. But in the past few years, I have noticed that such concerns also bother many, if not all, of my peers. It seemed odd how an entire generation of students is struggling to find these answers when their parents and older relatives never found this to be a significant problem and failed to relate to it. Most people learn to overcome this and lead better lives. But some fail to. And there has been an alarming rise in the number of people suffering from such lifestyle-related mental stress and consequential illnesses. The initial idea I started this project with was a very cynical take on our society’s exploitative, consumeristic ways and how that weighs down on the human mind. This idea, I believe, came from a place of great anger and frustration. But as I started this project and dug more deeply into this problem, I realised that there is a lot of anger and frustration already.
Details >>
Gangaur festival of Rajasthan
by Niharika Kumawat
by Niharika Kumawat
This project attempts a documentation of the Gangaur festival of Rajasthan and its different aspects and significance. Gangaur is celebrated over 18 days and is one of the major festivals of Rajasthan. This report documents its most important highlights over these 18 days and various processes and important elements associated with it and their significance. There’s also an emphasis on the cultural folklore and songs associated with this festival, which forms an important part of numerous other Hindu festivals. Thus, it’s also an attempt to highlight the cultural vibrancy of Rajasthan as a state. The information and pictures collected and documented are sourced from various research papers, web articles, and from primary research with family and relatives currently celebrating this festival. The project documents an overview of the festival celebrated across the state of Rajasthan, but some of the finer details are based entirely on primary research, like the Pooja Vidhi, and the timeline is more specific to how it’s celebrated in the city of Jaipur. Thus, it might have slight regional variations across different cities. At the end, an infographic based on an illustrated timeline of this festival and its important aspects has also been designed.
Details >>
Data Visualisation in Comparative Genomics
by Niharika Kumawat
by Niharika Kumawat
This project aims to deliver a data visualisation around the complex topic of “Comparative Genomics." The aim is to simplify a complex topic as such into a form that can be ingested by the general public with general insights and induce curiosity in them. The outcome is a web interface combining narrative and two interactive visualisations comparing the details of 30 widely known species of animals. A lot of static and dynamic tools exist to visualise genomic data, but most of them are often very complex for any non-field expert user to use. This project aims to offer an entry point to the general audience to get introduced to the field of Comparative Genomics and its basics. Two levels of comparison are undertaken in this project: one is general comparison of basic details with the first visualisation, and the second is comprehensive sequence comparison between the chosen species. The user can explore the details about the species of their interest by interacting with the tool. Genomics and comparative genomics, being a growing field of research, are important topics of interest, knowledge of which is important and can help individuals discover new opportunities in various fields.
Details >>
Educational game design based on The Periodic Table
by Niharika Kumawat
by Niharika Kumawat
Chemistry is one of the most disliked science subjects in the Indian School scenario when seen from an understanding and memorization perspective. Students think of chemistry as an abstract realm they have to deal with. Periodic table is an important topic in the chemistry course curriculum, connected to many other topics in chemistry, and involves a lot of memorization. This project delivers an educational board game based on the concepts of “The Periodic Table” targeted at students in grades 9th–12th. Thus, the aim is to provide a tool in the form of a fun and engaging game to help students learn, practice, and memorize. The focus was on coming up with an actually fun game mechanic that motivates the student to play while also feeding them with the knowledge and concepts of the periodic table in a less abstract way. Jr. Mendeleevs is a game based on the periodic table of elements for the students of classes 9th–12th. Players take the role of researchers and compete with each other to solve the problem cards dealt to them and discover the elements based on hints given on the cards. To discover an element, they’ll have to earn and spend the resources and discovery coins given to them. The game can be played at home or school with classmates, siblings, or even parents. Players can also introduce problem cards of their own to increase the difficulty of the game once they’re well equipped with the basics.
Details >>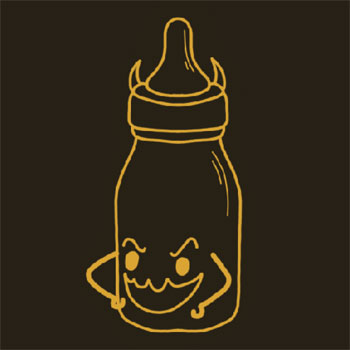
Infant and Maternal Nutrition
by Niharika Mohile
by Niharika Mohile
This report talks about the work I did over the autumn semester of 2021. It starts with an introduction to the topic of Infant and Maternal Nutrition, especially the problems in the area. It then shows my approach to the problems. We read about both primary and secondary data collection through doctors and other professionals in the field, as well as the collection of data from existing solutions. I then talk about my idea for a service design solution and then change course to a smaller solution that deals with videos made by CTARA, a body under IIT Bombay. Finally, I also present some posters I made for the project.
Details >>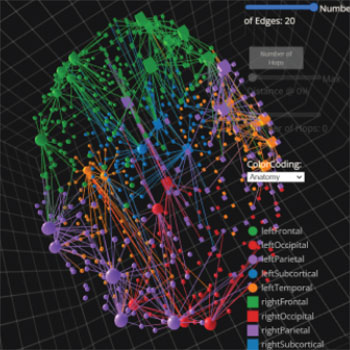
Visualisations in Affective Neuroscience
by Prita Raut
by Prita Raut
Affective neuroscience is an interdisciplinary field involving neuroscience and psychology where research involving data analysis is paving the way for new findings. This paper tells about the various types of visualisations in the field of affective neuroscience based on the nature of information. Neuroanatomy is of importance in this field, and based on that, the two broad categories identified are spatial and nonspatial visualisations.
Details >>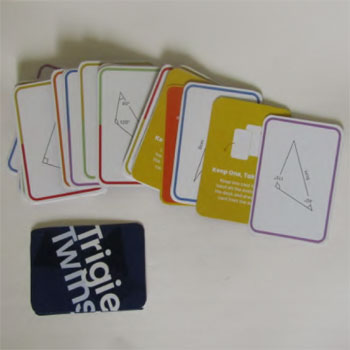
Designing a Game based on Secondary School Mathematics
by Prita Raut
by Prita Raut
Math is a subject that plays a crucial role to help develop analytical and logical reasoning skills. However, it is perceived as a difficult subject by students, and there is fear and anxiety associated with it, which affects the interest students have in studying it. New ways of teaching and learning have come up that attempt to make studying enjoyable. In this project, I have attempted to design a game to practice math in a fun way. TrigieTwins is a board game for students of Std 7th and Std 8th to practice the concepts of properties of triangles and congruence of triangles. In this game, players make pairs of congruent triangles and try to collect groups marked on the board, along with trying to stop their opponent from winning by using power cards. This game can be played in the school with classmates or at home with siblings, friends, or parents. For anyone who doesn’t know the concept of congruence or properties of triangles, a quick revision guide is provided that can be referred to play.
Details >>
Science Visualisation: Emotion and Affective Disorders
by Prita Raut
by Prita Raut
Affective neuroscience is an interdisciplinary field involving neuroscience and psychology. This project aims to design a data visualisation to simplify and present some of the research findings in the field of affective neuroscience related to similarities in animals and humans, behaviour and basis in neuroanatomy, and affective disorders in an attempt to explain the scientific reasoning behind them to the general audience through a web-based interactive infographic.
Details >>